🧩 HRRR in Zarr Format#
Selections of the HRRR archive are made available in Zarr format on AWS.
There are two ways to access zarr data with xarray
with
fsspecwith
s3fs
[2]:
import zarr
import fsspec
import xarray as xr
[3]:
# Lets grab a forecast file using fsspec

url = "s3://hrrrzarr/sfc/20200903/20200903_00z_fcst.zarr/2m_above_ground/TMP/2m_above_ground/"

ds = xr.open_zarr(fsspec.get_mapper(url, anon=True))
ds.TMP
[3]:
<xarray.DataArray 'TMP' (time: 36, projection_y_coordinate: 1059,
                         projection_x_coordinate: 1799)>
[68585076 values with dtype=float16]
Dimensions without coordinates: time, projection_y_coordinate,
                                projection_x_coordinate
Attributes:
    GRIB_PARAM:   [2, 0, 0, 0]
    coordinates:  forecast_reference_time forecast_period
    long_name:    2m_above_ground/TMP
units: K[4]:
import xarray as xr
import s3fs
[5]:
# Let's grab an analysis file using s3fs

fs = s3fs.S3FileSystem(anon=True)
url = "hrrrzarr/sfc/20200903/20200903_00z_anl.zarr/2m_above_ground/TMP/2m_above_ground/"
store = s3fs.S3Map(root=url, s3=fs, check=False)
ds = xr.open_zarr(store)
ds.TMP
[5]:
<xarray.DataArray 'TMP' (projection_y_coordinate: 1059,
                         projection_x_coordinate: 1799)>
[1905141 values with dtype=float16]
Dimensions without coordinates: projection_y_coordinate, projection_x_coordinate
Attributes:
    GRIB_PARAM:   [2, 0, 0, 0]
    coordinates:  forecast_reference_time time pressure height forecast_period
    long_name:    2m_above_ground/TMP
units: KIt looks like the projection coordinates are up a level
[6]:
fs = s3fs.S3FileSystem(anon=True)
url = "hrrrzarr/sfc/20200903/20200903_00z_fcst.zarr/2m_above_ground/TMP"
store = s3fs.S3Map(root=url, s3=fs, check=False)
ds2 = xr.open_zarr(store)
ds2
[6]:
<xarray.Dataset>
Dimensions:                  (time: 36, projection_x_coordinate: 1799,
                              projection_y_coordinate: 1059)
Coordinates:
  * projection_x_coordinate  (projection_x_coordinate) float64 -2.698e+06 ......
  * projection_y_coordinate  (projection_y_coordinate) float64 -1.587e+06 ......
  * time                     (time) datetime64[ns] 2020-09-03T01:00:00 ... 20...
Data variables:
    forecast_period          (time) timedelta64[ns] ...
forecast_reference_time datetime64[ns] ...[7]:
ds2.projection_x_coordinate
[7]:
<xarray.DataArray 'projection_x_coordinate' (projection_x_coordinate: 1799)>
array([-2697520.142522, -2694520.142522, -2691520.142522, ...,  2690479.857478,
        2693479.857478,  2696479.857478])
Coordinates:
* projection_x_coordinate (projection_x_coordinate) float64 -2.698e+06 ......
Attributes:
standard_name: projection_x_coordinate
units: m[8]:
ds2.forecast_reference_time
[8]:
<xarray.DataArray 'forecast_reference_time' ()>
[1 values with dtype=datetime64[ns]]
Attributes:
standard_name: forecast_reference_timeThe full variable (all chunks)#
[9]:
ds.TMP
[9]:
<xarray.DataArray 'TMP' (projection_y_coordinate: 1059,
                         projection_x_coordinate: 1799)>
[1905141 values with dtype=float16]
Dimensions without coordinates: projection_y_coordinate, projection_x_coordinate
Attributes:
    GRIB_PARAM:   [2, 0, 0, 0]
    coordinates:  forecast_reference_time time pressure height forecast_period
    long_name:    2m_above_ground/TMP
units: K[10]:
ds.TMP.plot()
[10]:
<matplotlib.collections.QuadMesh at 0x2c319fb5690>

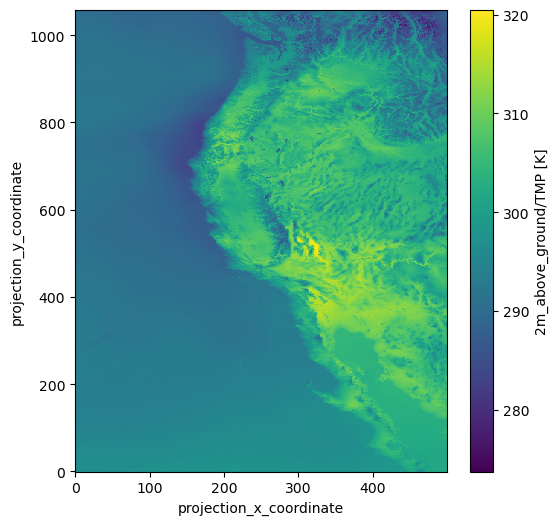
Now lets get only part of the variable; the Western United States chunck
[11]:
ds.TMP[:, :500]
[11]:
<xarray.DataArray 'TMP' (projection_y_coordinate: 1059,
                         projection_x_coordinate: 500)>
[529500 values with dtype=float16]
Dimensions without coordinates: projection_y_coordinate, projection_x_coordinate
Attributes:
    GRIB_PARAM:   [2, 0, 0, 0]
    coordinates:  forecast_reference_time time pressure height forecast_period
    long_name:    2m_above_ground/TMP
units: K[12]:
ds.TMP[:, :500].plot(figsize=(6, 6))
[12]:
<matplotlib.collections.QuadMesh at 0x2c31a4613c0>