AIGFS#
In December 2025, NOAA announced the release of three AI global forecasting systems.
NOAA deploys new generation of AI-driven global weather models
All three models are available for download in Herbie:
model="aigfs"model="aigefs"model="hgefs"
This notebook demonstrates how to download and use AIGFS data using Herbie.
[1]:
from herbie import Herbie
from herbie.toolbox import EasyMap, pc, ccrs
from herbie import paint

import matplotlib.pyplot as plt
There are two available products:
product="sfc"product="pres"
[2]:
H = Herbie("2026-02-01", model="aigfs", product="sfc")
H
✅ Found ┊ model=aigfs ┊ product=sfc ┊ 2026-Feb-01 00:00 UTC F00 ┊ GRIB2 @ nomads ┊ IDX @ local
[2]:
▌▌Herbie AIGFS model sfc product initialized 2026-Feb-01 00:00 UTC F00 ┊ source=nomads
[3]:
# Show all available sources
H.SOURCES
[3]:
{'nomads': 'https://nomads.ncep.noaa.gov/pub/data/nccf/com/aigfs/prod/aigfs.20260201/00/model/atmos/grib2/aigfs.t00z.sfc.f000.grib2'}
[4]:
H.inventory()
[4]:
| grib_message | start_byte | end_byte | range | reference_time | valid_time | variable | level | forecast_time | search_this | |
|---|---|---|---|---|---|---|---|---|---|---|
| 0 | 1 | 0 | 1002703.0 | 0-1002703 | 2026-02-01 | 2026-02-01 | UGRD | 10 m above ground | anl | :UGRD:10 m above ground:anl: |
| 1 | 2 | 1002704 | 1981711.0 | 1002704-1981711 | 2026-02-01 | 2026-02-01 | VGRD | 10 m above ground | anl | :VGRD:10 m above ground:anl: |
| 2 | 3 | 1981712 | 2512347.0 | 1981712-2512347 | 2026-02-01 | 2026-02-01 | TMP | 2 m above ground | anl | :TMP:2 m above ground:anl: |
| 3 | 4 | 2512348 | NaN | 2512348- | 2026-02-01 | 2026-02-01 | PRMSL | mean sea level | anl | :PRMSL:mean sea level:anl: |
[5]:
H = Herbie("2026-02-01", model="aigfs", product="pres")
H.inventory()
✅ Found ┊ model=aigfs ┊ product=pres ┊ 2026-Feb-01 00:00 UTC F00 ┊ GRIB2 @ nomads ┊ IDX @ local
[5]:
| grib_message | start_byte | end_byte | range | reference_time | valid_time | variable | level | forecast_time | search_this | |
|---|---|---|---|---|---|---|---|---|---|---|
| 0 | 1 | 0 | 673222.0 | 0-673222 | 2026-02-01 | 2026-02-01 | HGT | 50 mb | anl | :HGT:50 mb:anl: |
| 1 | 2 | 673223 | 1329174.0 | 673223-1329174 | 2026-02-01 | 2026-02-01 | HGT | 100 mb | anl | :HGT:100 mb:anl: |
| 2 | 3 | 1329175 | 1993554.0 | 1329175-1993554 | 2026-02-01 | 2026-02-01 | HGT | 150 mb | anl | :HGT:150 mb:anl: |
| 3 | 4 | 1993555 | 2656655.0 | 1993555-2656655 | 2026-02-01 | 2026-02-01 | HGT | 200 mb | anl | :HGT:200 mb:anl: |
| 4 | 5 | 2656656 | 3314383.0 | 2656656-3314383 | 2026-02-01 | 2026-02-01 | HGT | 250 mb | anl | :HGT:250 mb:anl: |
| ... | ... | ... | ... | ... | ... | ... | ... | ... | ... | ... |
| 73 | 74 | 77577252 | 78369407.0 | 77577252-78369407 | 2026-02-01 | 2026-02-01 | VVEL | 600 mb | anl | :VVEL:600 mb:anl: |
| 74 | 75 | 78369408 | 79179487.0 | 78369408-79179487 | 2026-02-01 | 2026-02-01 | VVEL | 700 mb | anl | :VVEL:700 mb:anl: |
| 75 | 76 | 79179488 | 80019147.0 | 79179488-80019147 | 2026-02-01 | 2026-02-01 | VVEL | 850 mb | anl | :VVEL:850 mb:anl: |
| 76 | 77 | 80019148 | 80844486.0 | 80019148-80844486 | 2026-02-01 | 2026-02-01 | VVEL | 925 mb | anl | :VVEL:925 mb:anl: |
| 77 | 78 | 80844487 | NaN | 80844487- | 2026-02-01 | 2026-02-01 | VVEL | 1000 mb | anl | :VVEL:1000 mb:anl: |
78 rows × 10 columns
[6]:
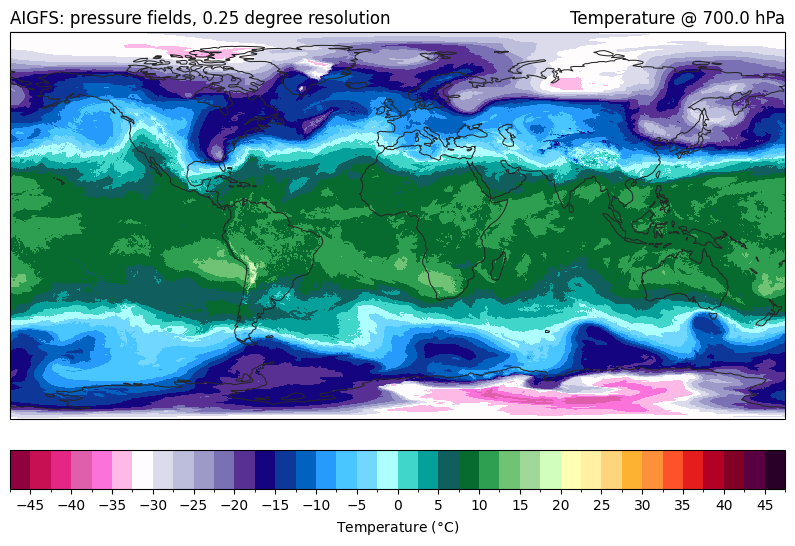
ds = H.xarray(":TMP:700 mb")
[7]:
ax = EasyMap(crs=ds.herbie.crs, figsize=[10, 8]).ax
p = ax.pcolormesh(
    ds.longitude,
    ds.latitude,
    ds.t - 273.15,
    transform=pc,
    **paint.NWSTemperature.kwargs2,
)
plt.colorbar(
    p, ax=ax, orientation="horizontal", pad=0.05, **paint.NWSTemperature.cbar_kwargs2
)

ax.set_title(f"{ds.t.GRIB_name} @ {ds.t.isobaricInhPa.item()} hPa", loc="right")
ax.set_title(f"{ds.model.upper()}: {H.product_description}", loc="left")
[7]:
Text(0.0, 1.0, 'AIGFS: pressure fields, 0.25 degree resolution')
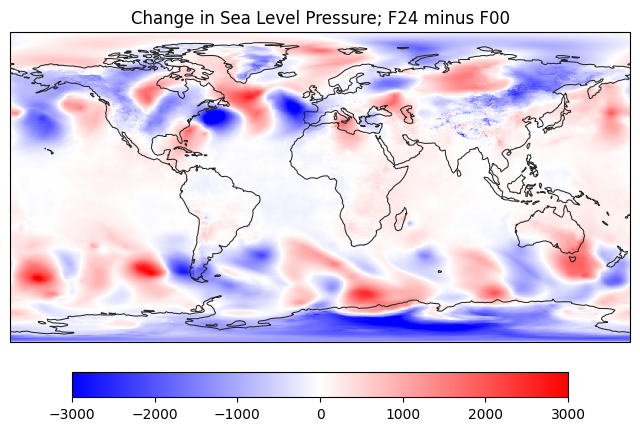
Now, going back to the surface product, just for fun, let’s plot the change in 24-hr sea level pressure
[8]:
H1 = Herbie("2026-02-01", model="aigfs", product="sfc", fxx=0)
H2 = Herbie("2026-02-01", model="aigfs", product="sfc", fxx=24)

diff = H2.xarray("PRMSL").prmsl - H1.xarray("PRMSL").prmsl

ax = EasyMap(figsize=[8, 8]).ax
p = ax.pcolormesh(
    diff.longitude, diff.latitude, diff, transform=pc, vmax=3000, vmin=-3000, cmap="bwr"
)

plt.colorbar(
    p,
    ax=ax,
    orientation="horizontal",
    pad=0.05,
    shrink=0.8,
)

plt.title("Change in Sea Level Pressure; F24 minus F00")
✅ Found ┊ model=aigfs ┊ product=sfc ┊ 2026-Feb-01 00:00 UTC F00 ┊ GRIB2 @ nomads ┊ IDX @ local
✅ Found ┊ model=aigfs ┊ product=sfc ┊ 2026-Feb-01 00:00 UTC F24 ┊ GRIB2 @ nomads ┊ IDX @ local
[8]:
Text(0.5, 1.0, 'Change in Sea Level Pressure; F24 minus F00')