HRRR#
This tutorial shows you how to download HRRR data from Amazon (and other sources) with the Herbie Python package.
Data Sources
|
Data source |
Archive Duration |
|---|---|---|
|
2014-07-30 to present |
|
|
Yesterday and today |
|
|
2014-07-30 to present |
|
|
2021-03-21 to present |
|
|
varies |
Model Initialization
Model cyles every hour.
Forecast Hour
For the most recent version of HRRR…
|
Forecast lead time |
|---|---|
|
available for runs initialized at 00z, 06z, 12z, 18z |
|
available for runs initialized at all other hours. |
Products
|
Product Description |
|---|---|
|
surface fields |
|
pressure levels |
|
native levels |
|
subhourly products |
[1]:
from herbie import Herbie
from toolbox import EasyMap, pc
from paint.standard2 import cm_tmp

import matplotlib.pyplot as plt
import cartopy.crs as ccrs
[2]:
H = Herbie(
    "2021-07-19",
    model="hrrr",
    product="sfc",
    fxx=0,
)
✅ Found ┊ model=hrrr ┊ product=sfc ┊ 2021-Jul-19 00:00 UTC F00 ┊ GRIB2 @ aws ┊ IDX @ aws
[5]:
# Show available products
H.PRODUCTS
[5]:
{'sfc': '2D surface level fields; 3-km resolution',
 'prs': '3D pressure level fields; 3-km resolution',
 'nat': 'Native level fields; 3-km resolution',
 'subh': 'Subhourly grids; 3-km resolution'}
[3]:
ds = H.xarray("TMP:2 m above")
ds
[3]:
<xarray.Dataset>
Dimensions:              (y: 1059, x: 1799)
Coordinates:
    time                 datetime64[ns] 2021-07-19
    step                 timedelta64[ns] 00:00:00
    heightAboveGround    float64 2.0
    latitude             (y, x) float64 ...
    longitude            (y, x) float64 ...
    valid_time           datetime64[ns] ...
Dimensions without coordinates: y, x
Data variables:
    t2m                  (y, x) float32 ...
    gribfile_projection  object None
Attributes:
    GRIB_edition:            2
    GRIB_centre:             kwbc
    GRIB_centreDescription:  US National Weather Service - NCEP
    GRIB_subCentre:          0
    Conventions:             CF-1.7
    institution:             US National Weather Service - NCEP
    model:                   hrrr
    product:                 sfc
    description:             High-Resolution Rapid Refresh - CONUS
    remote_grib:             https://noaa-hrrr-bdp-pds.s3.amazonaws.com/hrrr....
    local_grib:              C:\Users\blaylock\data\hrrr\20210719\subset_6eef...
search: TMP:2 m above[4]:
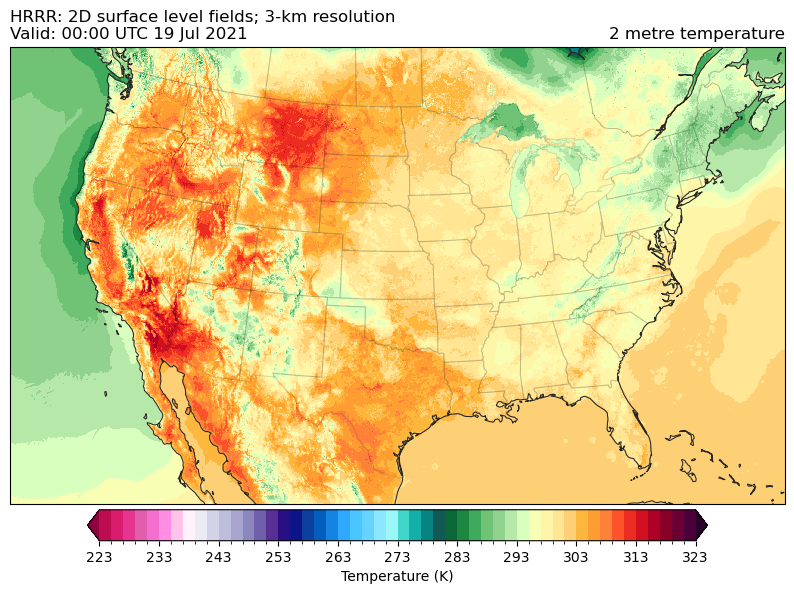
ax = EasyMap("50m", crs=ds.herbie.crs, figsize=[10, 8]).STATES().ax

p = ax.pcolormesh(
    ds.longitude,
    ds.latitude,
    ds.t2m,
    transform=pc,
    **cm_tmp(units="K").cmap_kwargs,
)
plt.colorbar(
    p,
    ax=ax,
    orientation="horizontal",
    pad=0.01,
    shrink=0.8,
    **cm_tmp(units="K").cbar_kwargs,
)

ax.set_title(
    f"{ds.model.upper()}: {H.product_description}\nValid: {ds.valid_time.dt.strftime('%H:%M UTC %d %b %Y').item()}",
    loc="left",
)
ax.set_title(ds.t2m.GRIB_name, loc="right")
[4]:
Text(1.0, 1.0, '2 metre temperature')
[ ]: