📍 Nearest Points#
WARNING: This is deprecated in favor of
ds.herbie.pick_points
This demonstration to get the value at the nearest latitude/longitude point builds on info from these sources:
Stack Overflow: https://stackoverflow.com/questions/58758480/xarray-select-nearest-lat-lon-with-multi-dimension-coordinates
MetPy Details: https://unidata.github.io/MetPy/latest/tutorials/xarray_tutorial.html?highlight=assign_y_x
[1]:
from herbie import Herbie
from metpy.units import units
import matplotlib.pyplot as plt
from toolbox import EasyMap, pc, ccrs
import numpy as np
import pandas as pd
import xarray as xr
from shapely.geometry import MultiPoint
from toolbox.gridded_data import pluck_points
[2]:
H = Herbie("2021-9-23")
ds = H.xarray("TMP:2 m")
✅ Found ┊ model=hrrr ┊ product=sfc ┊ 2021-Sep-23 00:00 UTC F00 ┊ GRIB2 @ aws ┊ IDX @ aws
👨🏻🏭 Created directory: [/home/blaylock/data/hrrr/20210923]
[3]:
ds
[3]:
<xarray.Dataset>
Dimensions:              (y: 1059, x: 1799)
Coordinates:
    time                 datetime64[ns] 2021-09-23
    step                 timedelta64[ns] 00:00:00
    heightAboveGround    float64 2.0
    latitude             (y, x) float64 21.14 21.15 21.15 ... 47.86 47.85 47.84
    longitude            (y, x) float64 237.3 237.3 237.3 ... 299.0 299.0 299.1
    valid_time           datetime64[ns] 2021-09-23
Dimensions without coordinates: y, x
Data variables:
    t2m                  (y, x) float32 297.7 297.7 297.8 ... 288.6 288.6 288.6
    gribfile_projection  object None
Attributes:
    GRIB_edition:            2
    GRIB_centre:             kwbc
    GRIB_centreDescription:  US National Weather Service - NCEP
    GRIB_subCentre:          0
    Conventions:             CF-1.7
    institution:             US National Weather Service - NCEP
    model:                   hrrr
    product:                 sfc
    description:             High-Resolution Rapid Refresh - CONUS
    remote_grib:             https://noaa-hrrr-bdp-pds.s3.amazonaws.com/hrrr....
    local_grib:              /home/blaylock/data/hrrr/20210923/subset_1beffd5...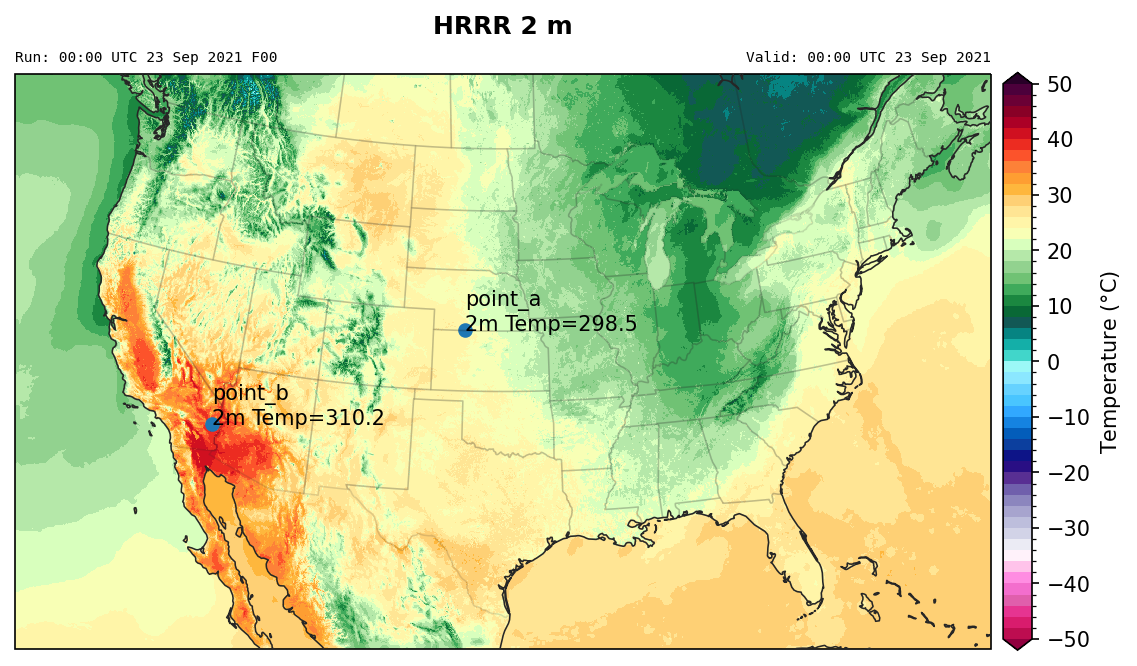
search: TMP:2 mHerbie has a custom xarray accessor called nearest_point to select values nearest a specified latitude and longitude point. The points argument accepts several different inputs.
a tuple of
(lon, lat)a list of tuples
[(lon, lat), (lon, lat), (lon, lat)]a Pandas DataFrame with columns
longitudeandlatitude(the Index will be used to name the points).a Shapely geometry
PointorMultiPointobject.
[4]:
# Get values nearest two points

dsi = ds.herbie.nearest_points(
    points=[(-100, 40), (-115, 34)],
    names=["point_a", "point_b"],
)
dsi
/home/blaylock/miniconda3/envs/herbie-dev/lib/python3.11/site-packages/metpy/xarray.py:382: UserWarning: More than one time coordinate present for variable "gribfile_projection".
  warnings.warn('More than one ' + axis + ' coordinate present for variable'
/home/blaylock/miniconda3/envs/herbie-dev/lib/python3.11/site-packages/metpy/xarray.py:382: UserWarning: More than one time coordinate present for variable "t2m".
  warnings.warn('More than one ' + axis + ' coordinate present for variable'
/home/blaylock/miniconda3/envs/herbie-dev/lib/python3.11/site-packages/metpy/xarray.py:382: UserWarning: More than one time coordinate present for variable "gribfile_projection".
  warnings.warn('More than one ' + axis + ' coordinate present for variable'
[4]:
<xarray.Dataset>
Dimensions:              (point: 2)
Coordinates:
    time                 datetime64[ns] 2021-09-23
    step                 timedelta64[ns] 00:00:00
    heightAboveGround    float64 2.0
    latitude             (point) float64 40.01 33.99
    longitude            (point) float64 260.0 245.0
    valid_time           datetime64[ns] 2021-09-23
    metpy_crs            object Projection: lambert_conformal_conic
    y                    (point) float64 1.707e+05 -3.483e+05
    x                    (point) float64 -2.135e+05 -1.609e+06
  * point                (point) <U7 'point_a' 'point_b'
    point_latitude       (point) int64 40 34
    point_longitude      (point) int64 -100 -115
Data variables:
    t2m                  (point) float32 298.5 310.2
    gribfile_projection  (point) object None None
Attributes:
    GRIB_edition:            2
    GRIB_centre:             kwbc
    GRIB_centreDescription:  US National Weather Service - NCEP
    GRIB_subCentre:          0
    Conventions:             CF-1.7
    institution:             US National Weather Service - NCEP
    model:                   hrrr
    product:                 sfc
    description:             High-Resolution Rapid Refresh - CONUS
    remote_grib:             https://noaa-hrrr-bdp-pds.s3.amazonaws.com/hrrr....
    local_grib:              /home/blaylock/data/hrrr/20210923/subset_1beffd5...
search: TMP:2 m[6]:
ds.herbie.plot()

plt.scatter(dsi.longitude, dsi.latitude, transform=pc)

for i in dsi.t2m:
    plt.text(
        i.longitude.item(),
        i.latitude.item(),
        f"{i.point.item()}\n2m Temp={i.item():.1f}",
        transform=pc,
    )
cfgrib variable: t2m
GRIB_cfName air_temperature
GRIB_cfVarName t2m
GRIB_name 2 metre temperature
GRIB_units K
GRIB_typeOfLevel heightAboveGround
/home/blaylock/miniconda3/envs/herbie-dev/lib/python3.11/site-packages/metpy/xarray.py:382: UserWarning: More than one time coordinate present for variable "gribfile_projection".
  warnings.warn('More than one ' + axis + ' coordinate present for variable'
/home/blaylock/miniconda3/envs/herbie-dev/lib/python3.11/site-packages/metpy/xarray.py:382: UserWarning: More than one time coordinate present for variable "t2m".
  warnings.warn('More than one ' + axis + ' coordinate present for variable'
/home/blaylock/miniconda3/envs/herbie-dev/lib/python3.11/site-packages/metpy/xarray.py:382: UserWarning: More than one time coordinate present for variable "gribfile_projection".
  warnings.warn('More than one ' + axis + ' coordinate present for variable'
[10]:
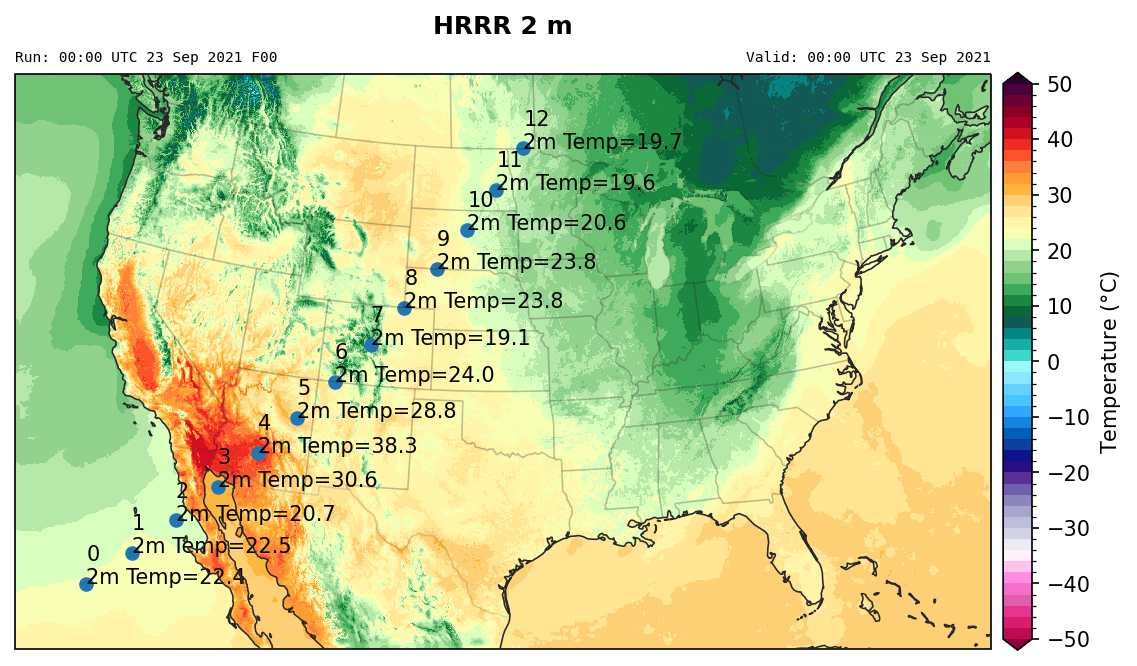
# Alternatively, we can specify our points of interest using a DataFrame

df = pd.DataFrame(
    {
        "longitude": range(-120, -95, 2),
        "latitude": range(25, 50, 2),
    }
)

dsi2 = ds.herbie.nearest_points(points=df)
dsi2
/home/blaylock/miniconda3/envs/herbie-dev/lib/python3.11/site-packages/metpy/xarray.py:382: UserWarning: More than one time coordinate present for variable "gribfile_projection".
  warnings.warn('More than one ' + axis + ' coordinate present for variable'
/home/blaylock/miniconda3/envs/herbie-dev/lib/python3.11/site-packages/metpy/xarray.py:382: UserWarning: More than one time coordinate present for variable "t2m".
  warnings.warn('More than one ' + axis + ' coordinate present for variable'
/home/blaylock/miniconda3/envs/herbie-dev/lib/python3.11/site-packages/metpy/xarray.py:382: UserWarning: More than one time coordinate present for variable "gribfile_projection".
  warnings.warn('More than one ' + axis + ' coordinate present for variable'
[10]:
<xarray.Dataset>
Dimensions:              (point: 13)
Coordinates:
    time                 datetime64[ns] 2021-09-23
    step                 timedelta64[ns] 00:00:00
    heightAboveGround    float64 2.0
    latitude             (point) float64 25.01 27.01 29.0 ... 44.99 46.99 49.0
    longitude            (point) float64 240.0 242.0 244.0 ... 260.0 262.0 264.0
    valid_time           datetime64[ns] 2021-09-23
    metpy_crs            object Projection: lambert_conformal_conic
    y                    (point) float64 -1.23e+06 -1.056e+06 ... 1.176e+06
    x                    (point) float64 -2.305e+06 -2.053e+06 ... 1.105e+05
  * point                (point) int64 0 1 2 3 4 5 6 7 8 9 10 11 12
    point_latitude       (point) int64 25 27 29 31 33 35 37 39 41 43 45 47 49
    point_longitude      (point) int64 -120 -118 -116 -114 ... -102 -100 -98 -96
Data variables:
    t2m                  (point) float32 22.38 22.5 20.69 ... 20.56 19.63 19.69
    gribfile_projection  (point) object None None None None ... None None None
Attributes:
    GRIB_edition:            2
    GRIB_centre:             kwbc
    GRIB_centreDescription:  US National Weather Service - NCEP
    GRIB_subCentre:          0
    Conventions:             CF-1.7
    institution:             US National Weather Service - NCEP
    model:                   hrrr
    product:                 sfc
    description:             High-Resolution Rapid Refresh - CONUS
    remote_grib:             https://noaa-hrrr-bdp-pds.s3.amazonaws.com/hrrr....
    local_grib:              /home/blaylock/data/hrrr/20210923/subset_1beffd5...
search: TMP:2 m[11]:
ds.herbie.plot()

plt.scatter(dsi2.longitude, dsi2.latitude, transform=pc)

for i in dsi2.t2m:
    plt.text(
        i.longitude.item(),
        i.latitude.item(),
        f"{i.point.item()}\n2m Temp={i.item():.1f}",
        transform=pc,
    )
cfgrib variable: t2m
GRIB_cfName air_temperature
GRIB_cfVarName t2m
GRIB_name 2 metre temperature
GRIB_units C
GRIB_typeOfLevel heightAboveGround
/home/blaylock/miniconda3/envs/herbie-dev/lib/python3.11/site-packages/metpy/xarray.py:382: UserWarning: More than one time coordinate present for variable "gribfile_projection".
  warnings.warn('More than one ' + axis + ' coordinate present for variable'
/home/blaylock/miniconda3/envs/herbie-dev/lib/python3.11/site-packages/metpy/xarray.py:382: UserWarning: More than one time coordinate present for variable "t2m".
  warnings.warn('More than one ' + axis + ' coordinate present for variable'
/home/blaylock/miniconda3/envs/herbie-dev/lib/python3.11/site-packages/metpy/xarray.py:382: UserWarning: More than one time coordinate present for variable "gribfile_projection".
  warnings.warn('More than one ' + axis + ' coordinate present for variable'
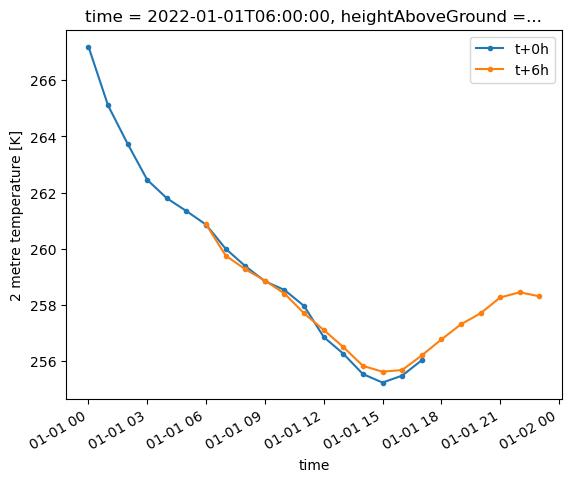
We can make timeseries from a point by plucking point from FastHerbie
[12]:
from herbie import FastHerbie
[13]:
DATES = pd.date_range("2022-01-01", periods=2, freq="6H")
fxx = range(18)
FH = FastHerbie(DATES=DATES, fxx=fxx, max_threads=1)
ds = FH.xarray("TMP:2 m")
ds
Canceled future for execute_request message before replies were done
The Kernel crashed while executing code in the the current cell or a previous cell. Please review the code in the cell(s) to identify a possible cause of the failure. Click <a href='https://aka.ms/vscodeJupyterKernelCrash'>here</a> for more info. View Jupyter <a href='command:jupyter.viewOutput'>log</a> for further details.
[8]:
dsi = ds.herbie.nearest_points(points=(-100, 40))
dsi
[8]:
<xarray.Dataset>
Dimensions:              (time: 2, step: 18, point: 1)
Coordinates:
  * time                 (time) datetime64[ns] 2022-01-01 2022-01-01T06:00:00
  * step                 (step) timedelta64[ns] 00:00:00 01:00:00 ... 17:00:00
    heightAboveGround    float64 2.0
    latitude             float64 40.01
    longitude            float64 260.0
    valid_time           (step, time) datetime64[ns] 2022-01-01 ... 2022-01-0...
    metpy_crs            object Projection: lambert_conformal_conic
    y                    float64 1.707e+05
    x                    float64 -2.135e+05
Dimensions without coordinates: point
Data variables:
    t2m                  (point, step, time) float32 267.2 260.9 ... 256.0 258.3
    gribfile_projection  (point) object None
Attributes:
    GRIB_edition:            2
    GRIB_centre:             kwbc
    GRIB_centreDescription:  US National Weather Service - NCEP
    GRIB_subCentre:          0
    Conventions:             CF-1.7
    institution:             US National Weather Service - NCEP
    model:                   hrrr
    product:                 sfc
    description:             High-Resolution Rapid Refresh - CONUS
search: TMP:2 m[10]:
dsi.isel(time=0, point=0).t2m.plot(x="valid_time", marker=".", label="t+0h")
dsi.isel(time=1, point=0).t2m.plot(x="valid_time", marker=".", label="t+6h")
plt.legend()
[10]:
<matplotlib.legend.Legend at 0x25500b9b370>
[ ]: